Chaos: Bifurcation Diagrams
I'm currently reading "Chaos" by James Gleick and wanted to play with the ideas in code and recreate some of the images, specifically the bifurcation diagrams. These diagrams are used in the study of dynamical systems and help reveal complex system behaviors that emerge as a single control parameter varies.
To create these diagrams we iterate a function, meaning \(x_{n+1} = f(x_{n})\), and record the long-term pattern of behavior for different values of the control parameter. This means for each control parameter value we record a series of state values after iterating a bunch and letting the system reach a steady rhythm. When we plot all this data together we can see how the systems long-term behavior evolves throughout parameter space. By mapping out the entire parameter space, bifurcation diagrams illuminate the borderlines between order and chaos and the tipping points where a small tweak in the parameter can lead to a dramatic transformation in the system.
This type of sensitivity to initial conditions and parameter settings is a cornerstone of chaotic systems. In exploring these diagrams, we gain a deeper understanding of the underlying patterns inside many chaotic non-linear systems.
Bifurcation Diagrams in Python
from typing import List, Callable
import math

import pandas as pd
import matplotlib.pyplot as plt
import numpy as np

def logistic_map(x, r):
    return r * (x - x**2)

def sine_map(x, r):
    return r * math.sin(math.pi * x)

def tent_map(x, r):
    if x < 0.5:
        return r * x
    else:
        return r * (1 - x)

def iterate_f(
    f: Callable,
    n: int,
    x_init: float,
    control_param: float,
    store_vals: bool = True,
    **kwargs
):
    """
    Iterate given function and return either all intermediate vals
    or just the last val.
    """
    x = x_init
    vals = []
    for _ in range(n):
        x = f(x, control_param, **kwargs)
        if store_vals:
            vals.append(x)
    return vals if store_vals else x

def f_steady_vals(
    f: Callable,
    steady_n: int,
    transient_n: int,
    x_init: float,
    control_param: float,
    **kwargs
) -> List[float]:
    """
    Get 'steady_n' state values after iterating 'transient_n'
    steps for given function for some constant control param value.
    """
    x = iterate_f(f, transient_n, x_init, control_param, store_vals=False, **kwargs)
    return iterate_f(f, steady_n, x, control_param, store_vals=True, **kwargs)

def get_bifurcation_data(
    f: Callable,
    steady_n: int,
    transient_n: int,
    x_init: float,
    control_param_vals: List[float],
    **kwargs
) -> {str: List[float], str: List[float]}:
    cp_vals = []
    state_vals = []
    for cp in control_param_vals:
        steady_vals = f_steady_vals(f, steady_n, transient_n, x_init, cp, **kwargs)
        cp_vals += [cp] * steady_n
        state_vals += steady_vals

    return {"cp_vals": cp_vals, "state_vals": state_vals}

def get_bifurcation_fig(
    title: str,
    f: Callable,
    steady_n: int,
    transient_n: int,
    x_init: float,
    control_param_vals: List[float],
    **kwargs
):
    data = get_bifurcation_data(
        f, steady_n, transient_n, x_init, control_param_vals, **kwargs
    )
    xs = data["cp_vals"]
    ys = data["state_vals"]

    fig, ax = plt.subplots()
    ax.plot(xs, ys, ",k")
    ax.set_title(title)
    ax.set_xlabel("Control Parameter")
    ax.set_ylabel("State")

    return fig
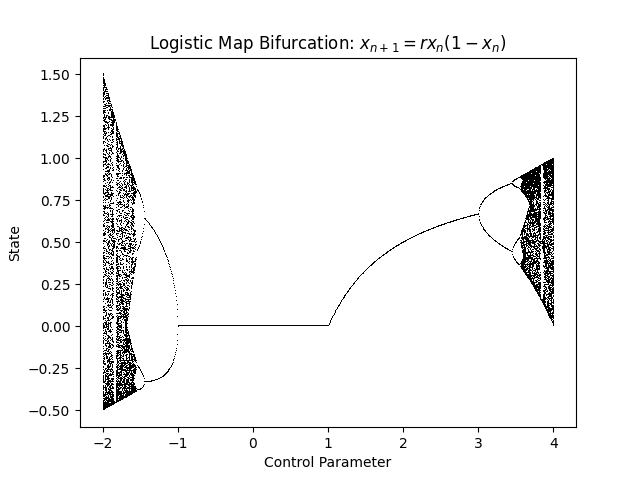
Logistic Map
f = logistic_map
steady_n = 100
transient_n = 1000
x_init = 0.4
control_param_vals = np.linspace(-2, 4, 1000)
title = 'Logistic Map Bifurcation: $x_{n+1}=rx_{n}(1-x_{n})$'
fig = get_bifurcation_fig(title, f, steady_n, transient_n, x_init, control_param_vals)

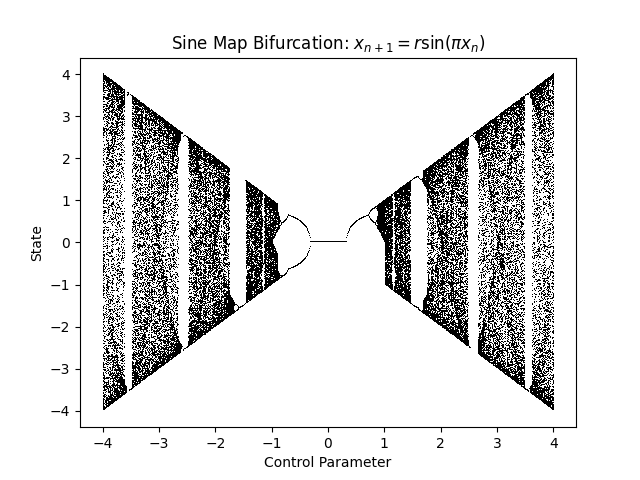
Sine Map
f = sine_map
steady_n = 100
transient_n = 10000
x_init = 0.4
control_param_vals = np.linspace(-4, 4, 1000)
title = 'Sine Map Bifurcation: $x_{n+1}=r \sin(\pi x_{n})$'
fig = get_bifurcation_fig(title, f, steady_n, transient_n, x_init, control_param_vals)

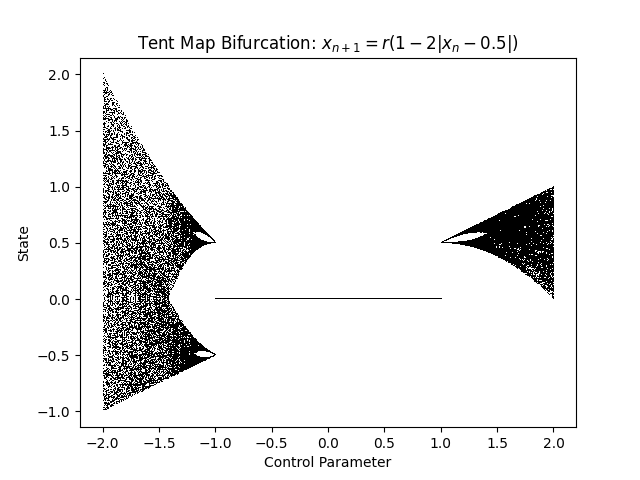
Tent Map
f = tent_map
steady_n = 100
transient_n = 10000
x_init = 0.4
control_param_vals = np.linspace(-2, 2, 1000)
title = 'Tent Map Bifurcation: $x_{n+1}=r(1-2|x_{n}-0.5|)$'
fig = get_bifurcation_fig(title, f, steady_n, transient_n, x_init, control_param_vals)
